Google is the most well known and most used website on the planet. You can go up to almost anyone on the street and ask them if they know what Google is, and most will undoubtedly say yes. Ask them which questions about what political party is in power, geography of the world, or what movies are currently in theater, and they are less likely to have the answer. Luckily, they can always ‘Google it’!
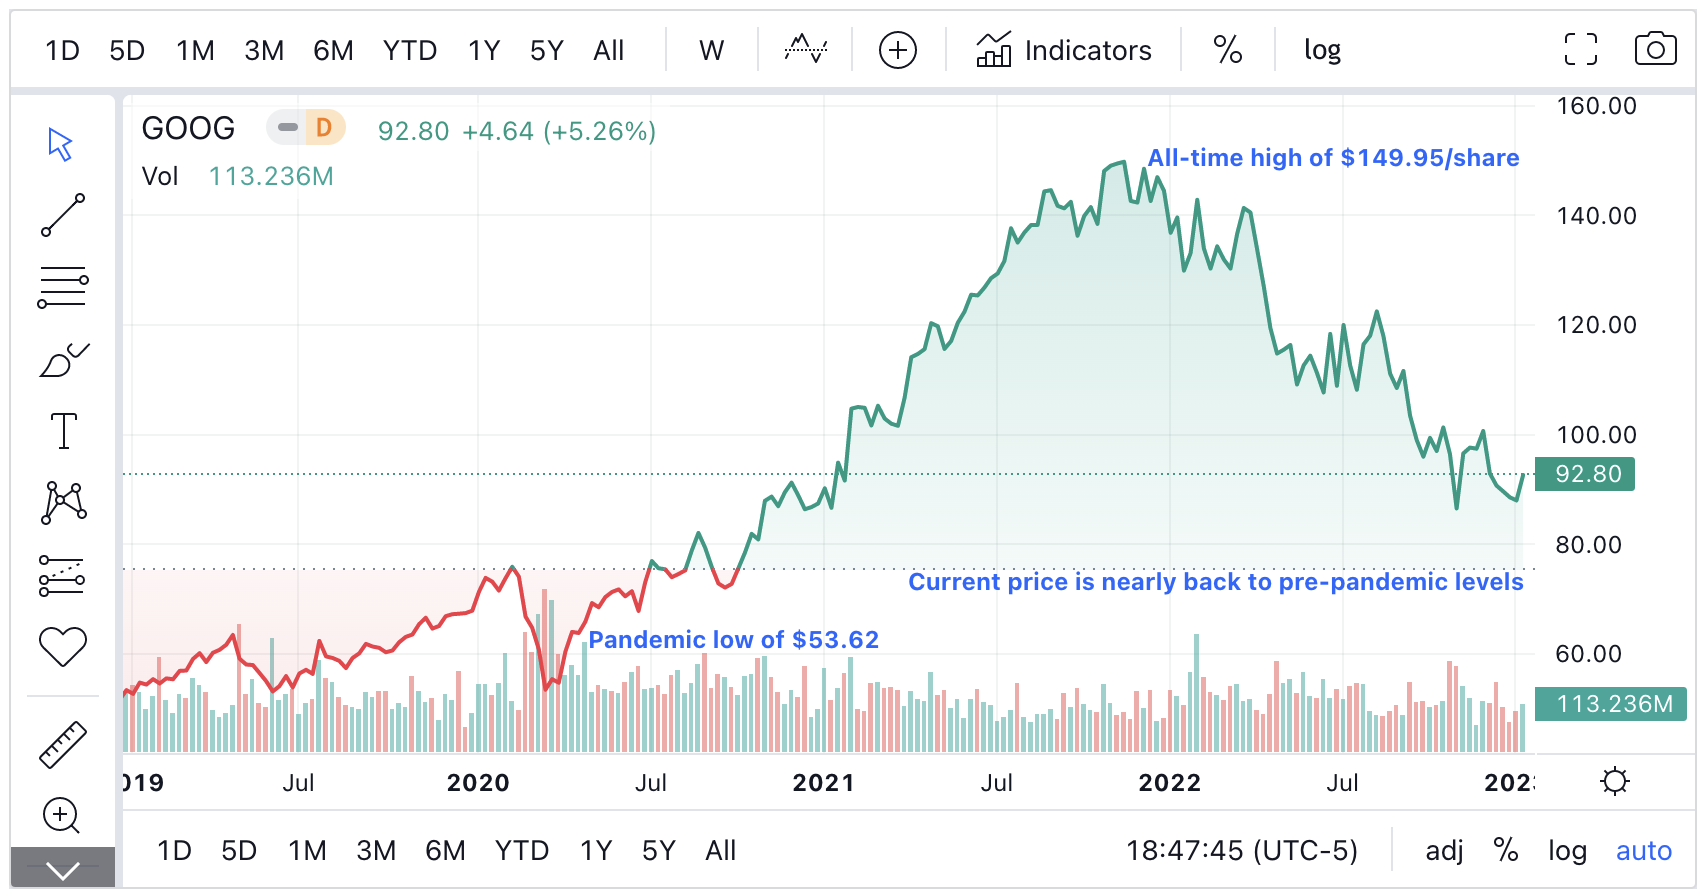
Despite that, Alphabet has not been able to escape the tech collapse over the last year. After enjoying a 180% gain since the March 2020 covid lows, it has since dropped over 40%, nearly bringing the current share price of $86 back to the pre-pandemic high of $76. They have recently announced layoffs in certain segments, in addition to cutting back on new hires for 2023.
In my last blog post, I detailed why I believed Meta was undervalued despite all their issues, and why I started a position at an average price ~$115. In this post I’m going to go over Alphabet and make the case why I think it is currently trading at ~fair value (and why I bought it anyway)!
Disclaimer: This blog post may contain affiliate links, where I may earn a small commission if you sign up. This blog post is not financial advice and is meant for informational/entertainment purposes only.
- History of Alphabet
- Alphabet Segments
- Competition
- Financials
- Share Buybacks
- Quant Ratings
- Intrinsic Value - Discounted Cash Flow (DCF) Calculation
- Conclusion
History of Alphabet
Google is the leader in online advertising, having been the largest search engine for nearly two decades (anyone remember AOL? MSN?). They have also expanded into cloud-based solutions, apps and in-app purchases, sales of products and services, digital content products, and hardware.
Google was incorporated in September 1998 in California and reincorporated in Delaware in August 2003. In 2015, Alphabet Inc. became the holding company for Google.
At the time of this writing Google is sitting at a market cap of $1.2 trillion, making it the 3rd largest public company in America, behind only Apple ($2.26 trillion) and Microsoft ($1.83 trillion). In October of 2022, like previous months, Google (16.59B visits) was the most visited website in the United States, with YouTube being second (10.83B visits).
Alphabet Segments
Alphabet has many different revenue sources. I could probably make an entire blog post just talking about all the different projects Alphabet has going on. They break down their segments as Google Services, Google Cloud, and Other Bets.
Google Services contains products and services such as ads, Android (operating system), Chrome (Browser), hardware (Pixel), Google Maps, Google Play, Search, and YouTube. YouTube has been expanding rapidly, and not just on computers and phones. Global viewers are watching 700 million+ hours of YouTube content on TV daily. YouTube shorts is Google’s answer to the threat of TikTok, and has seen 1.5 billion users every month, with 30 billion views. As of September, they have begun to try and monetize Shorts.
Google Cloud includes Google’s infrastructure and platform services, collaboration tools, and other services for enterprise customers. Alphabet has been investing massively into Google Cloud with CEO Sundar Pichai often stating it is a key priority for the company. Google Workspace is now used by over 8 million businesses. In September Alphabet closed on the acquisition of Mandiant, a cybersecurity firm.
Other bets contain all their other investments that don’t really fit into any other category yet. Some companies within other bets are Access (Google Fiber), Waymo (Self-driving vehicles), Intrinsic (Robotics), DeepMind (Artificial Intelligence), Nest (Smart Home Devices), Verily (Human Health), Wing (Drone-based Delivery), just to name a few. Most of the revenue from other bets is generated from the sale of health technology and internet services.
Competition
Alphabet is facing increasing competition in all areas of their business, including search engines (advertising), the cloud, hardware products, and software. The technology industry is continuing to innovate, and it’s hard to predict where we will be 10 years from now.
Although Google has a stronghold in the search engine market, there continues to be innovation which can and should be considered a potential threat for their advertising business. Google holds 92.2% of the total search engine market share, while Microsoft’s Bing has 3.42%. Microsoft is continuing to try and take some of that market share away, and just announced they are working towards a $10 billion investment into OpenAI, which owns ChatGPT, with hopes of implementing it into their search engine and operating systems.
Many people think ChatGPT is a major threat to Google, since it allows people to get a more human-like answer to their question, without having to search through many pages. Alphabet does have its own AI chatbots similar to ChatGPT (which are likely just as good, if not better) such as Moana and Sparrow, but they have not been released for public use at this time.
My concern is what these advancements mean for advertising. 10 years from now I’m not sure if people will be going to Google on physical devices to find what they’re looking for. With technological advances in AR, AI, and VR, I believe it may be more likely that people use different devices to get information (such as AR glasses, devices such as Google Assistant, Alexa, Siri, ChatGPT, or even chip implant companies such as Neuralink). If that is the case, I’m not sure how advertising fits in. With something like AR glasses, I can see companies being able to slide ads in (annoying!), but with voice systems like Google Assistant it would be harder. In terms of AI chat tools like ChatGPT, it remains to be seen exactly how advertising would fit into that, or how it can be monetized successfully.
In their cloud segment, Alphabet competes with other cloud solutions such as Amazon Web Services, Microsoft Azure, and Alibaba Cloud. Amazon is currently leading the market with 34% market share, with Microsoft Azure being second with 21%, and Google Cloud being third with 10%. Revenue from the cloud segment has increased 46% as a CAGR since 2017, when they had $4 billion. In the TTM they have had $24.5 billion. They continue to invest heavily, and have not yet seen a profit.
The ’Google Other’ segment of revenue contains revenue from Google Play, Devices and Services (Pixel phone, Fitbit, Google Home products), YouTube Premium/TV subscriptions, and other products and services. They face various competition in this segment, such as from Apple (App Store, iPhone, Apple TV, iOS, Siri), other streaming companies, and other cellphone manufacturers. In 2017 Google Other accounted for $10.9 billion in revenue, while in the TTM it accounted for $28.4 billion. This represents a CAGR of 22.3%.
Financials
There’s a few metrics I like to look at when looking at a company to invest in. While knowing past performance does not indicate future performance, it is good to get an idea on the trend of the company.
Revenue & Cost of Revenue
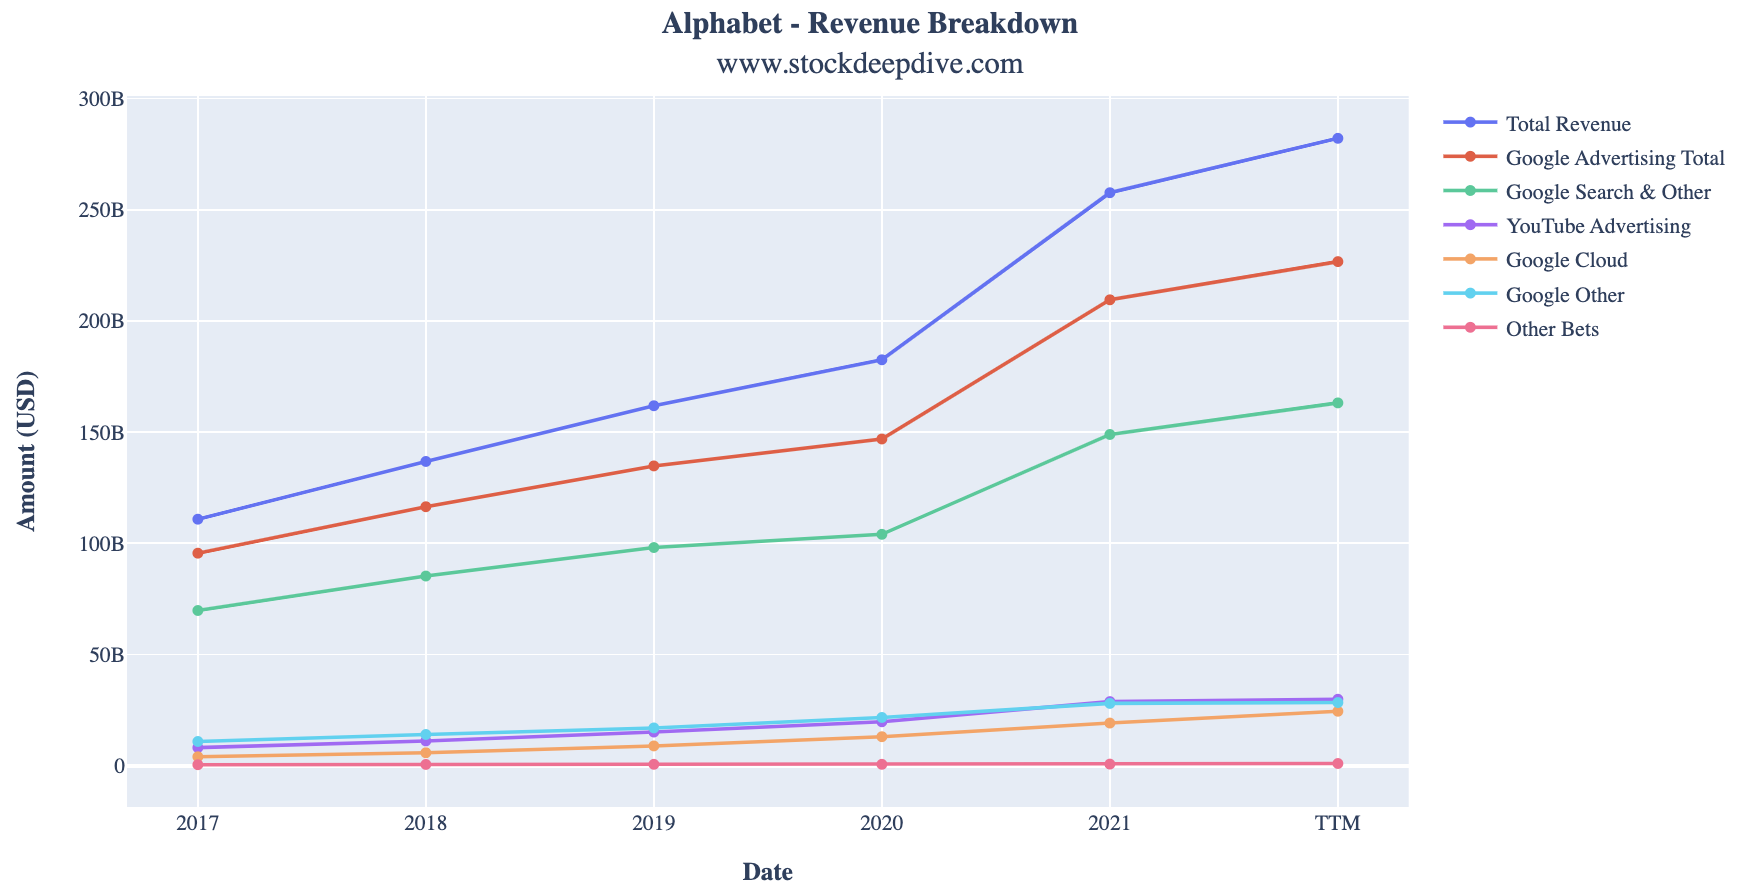
Alphabet has many sources of revenue, with most coming from advertising. In the 9 months ending September 30, 2022, they had $206.8 billion in revenue, with $185.7 billion coming from Google Services ($120 billion from Google Search, $21 billion from YouTube ads, $24 billion from Google Network, and $20 billion from ‘Google Other’). Of that $185.7 billion, $165.4 billion is considered to be from their various advertising platforms.
Google cloud has also been growing fast, with $19 billion in revenue in the first 3 quarters of 2022, compared to $13.7 billion in the first 9 months of 2021.
In the graph below, you can see how revenue from Alphabet’s different sources has changed over time. This allows you to easily visualize how much of Alphabet’s total revenue is comprised of Google Advertising, and why I’m concerned about the future of advertising.
Operating Margin
Google services is currently the only segment that has a positive operating margin. In the trailing nine months Google services has had operating income of $65.5 billion (35.5% operating margin), Google Cloud has operating loss of $2.5 billion (-13% operating margin), and ‘Other Bets’ has a loss of $4.45 billion. Their overall operating margin for the trailing nine months has been 27.4%. In FY (Fiscal Year) 2021, their operating margin was 31%, while in FY 2020 it was 23%.
A large part of operating expenses has been an increase in headcount at Alphabet, which has ballooned to 186,779 as of September 2022, compared to 150,028 in September 2021 and 118,899 as of December 31, 2019.
Activist investor TCI, who owns a $6 billion stake in Alphabet, recently wrote a letter to CEO Sundar Pichai, asking to trim headcount and lower salary expense. Alphabet’s median compensation is $295,884 for 2021, much higher than other tech firms.
Balance Sheet
Alphabet has an incredible $139.6 billion in cash, cash equivalents, and marketable securities currently. Comparing that to their debt of $14.8 billion makes it clear they are in a very strong financial position to withstand any economic downturn. They currently have $188 billion in current assets, and $64 billion in current liabilities, giving them a current ratio of 2.52.
Cash Flow
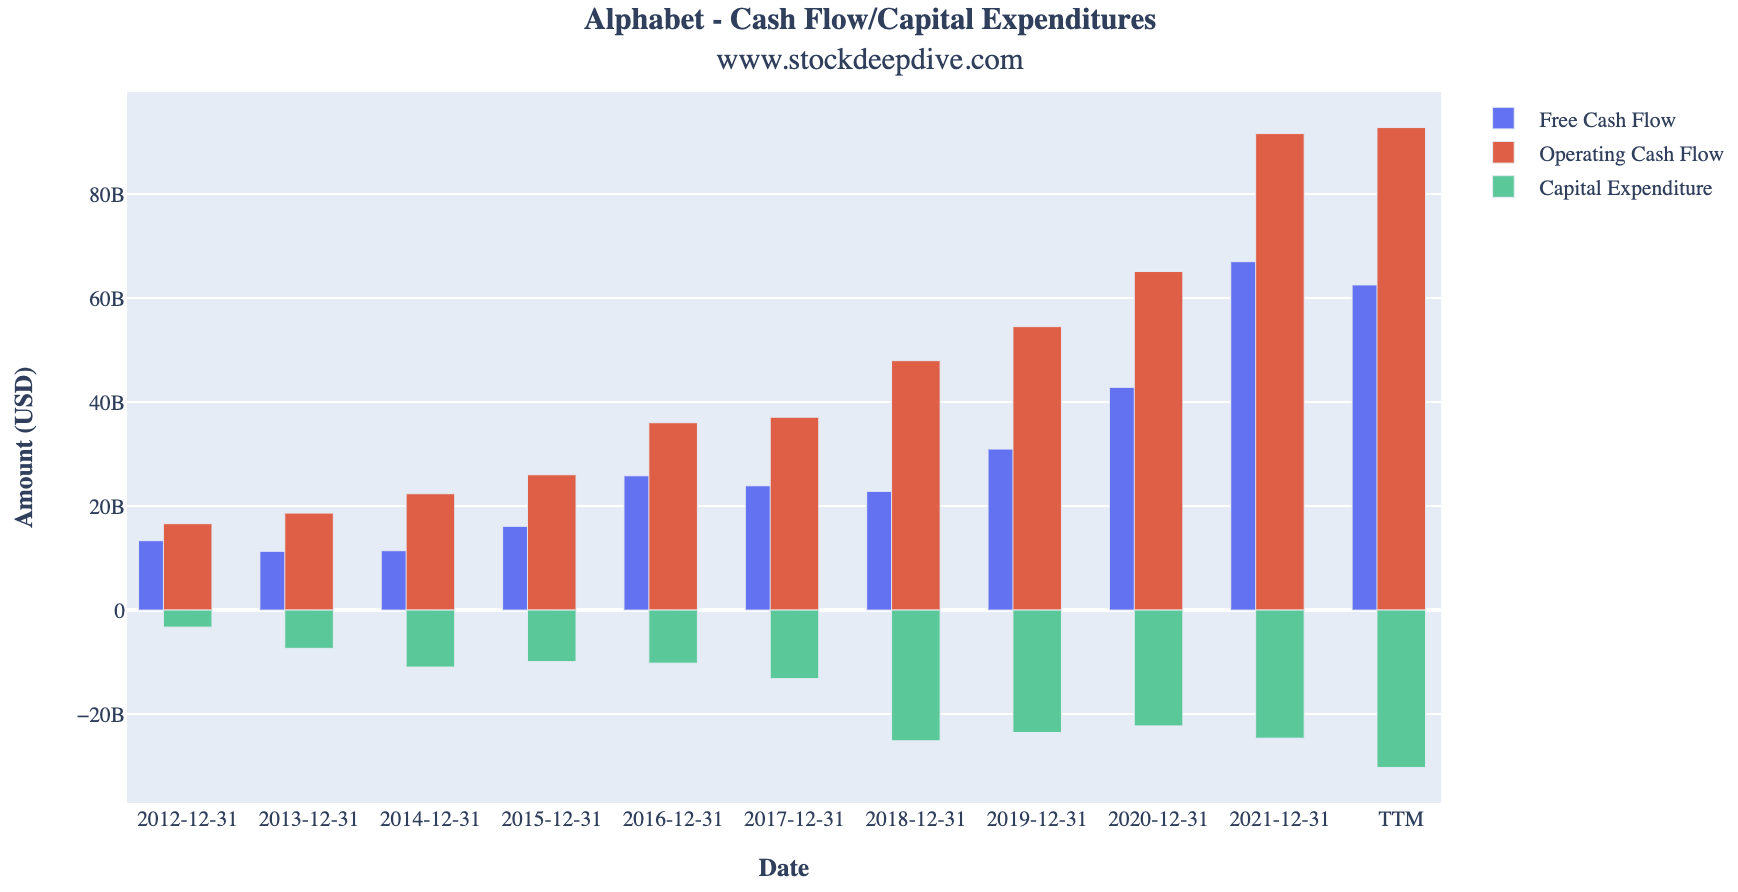
In the chart below, you can see how operating cash flow, free cash flow, and the amount invested in capital expenditures has changed over time. You can see capital expenditures has greatly increased, particularly in the trailing 12 months. This increase has largely been due to Alphabet investing heavily into technical infrastructure, with the largest driver being servers. This investment is needed in order to continue innovating with AI and expanding cloud offerings, but I predict it will level off at some point in the future.
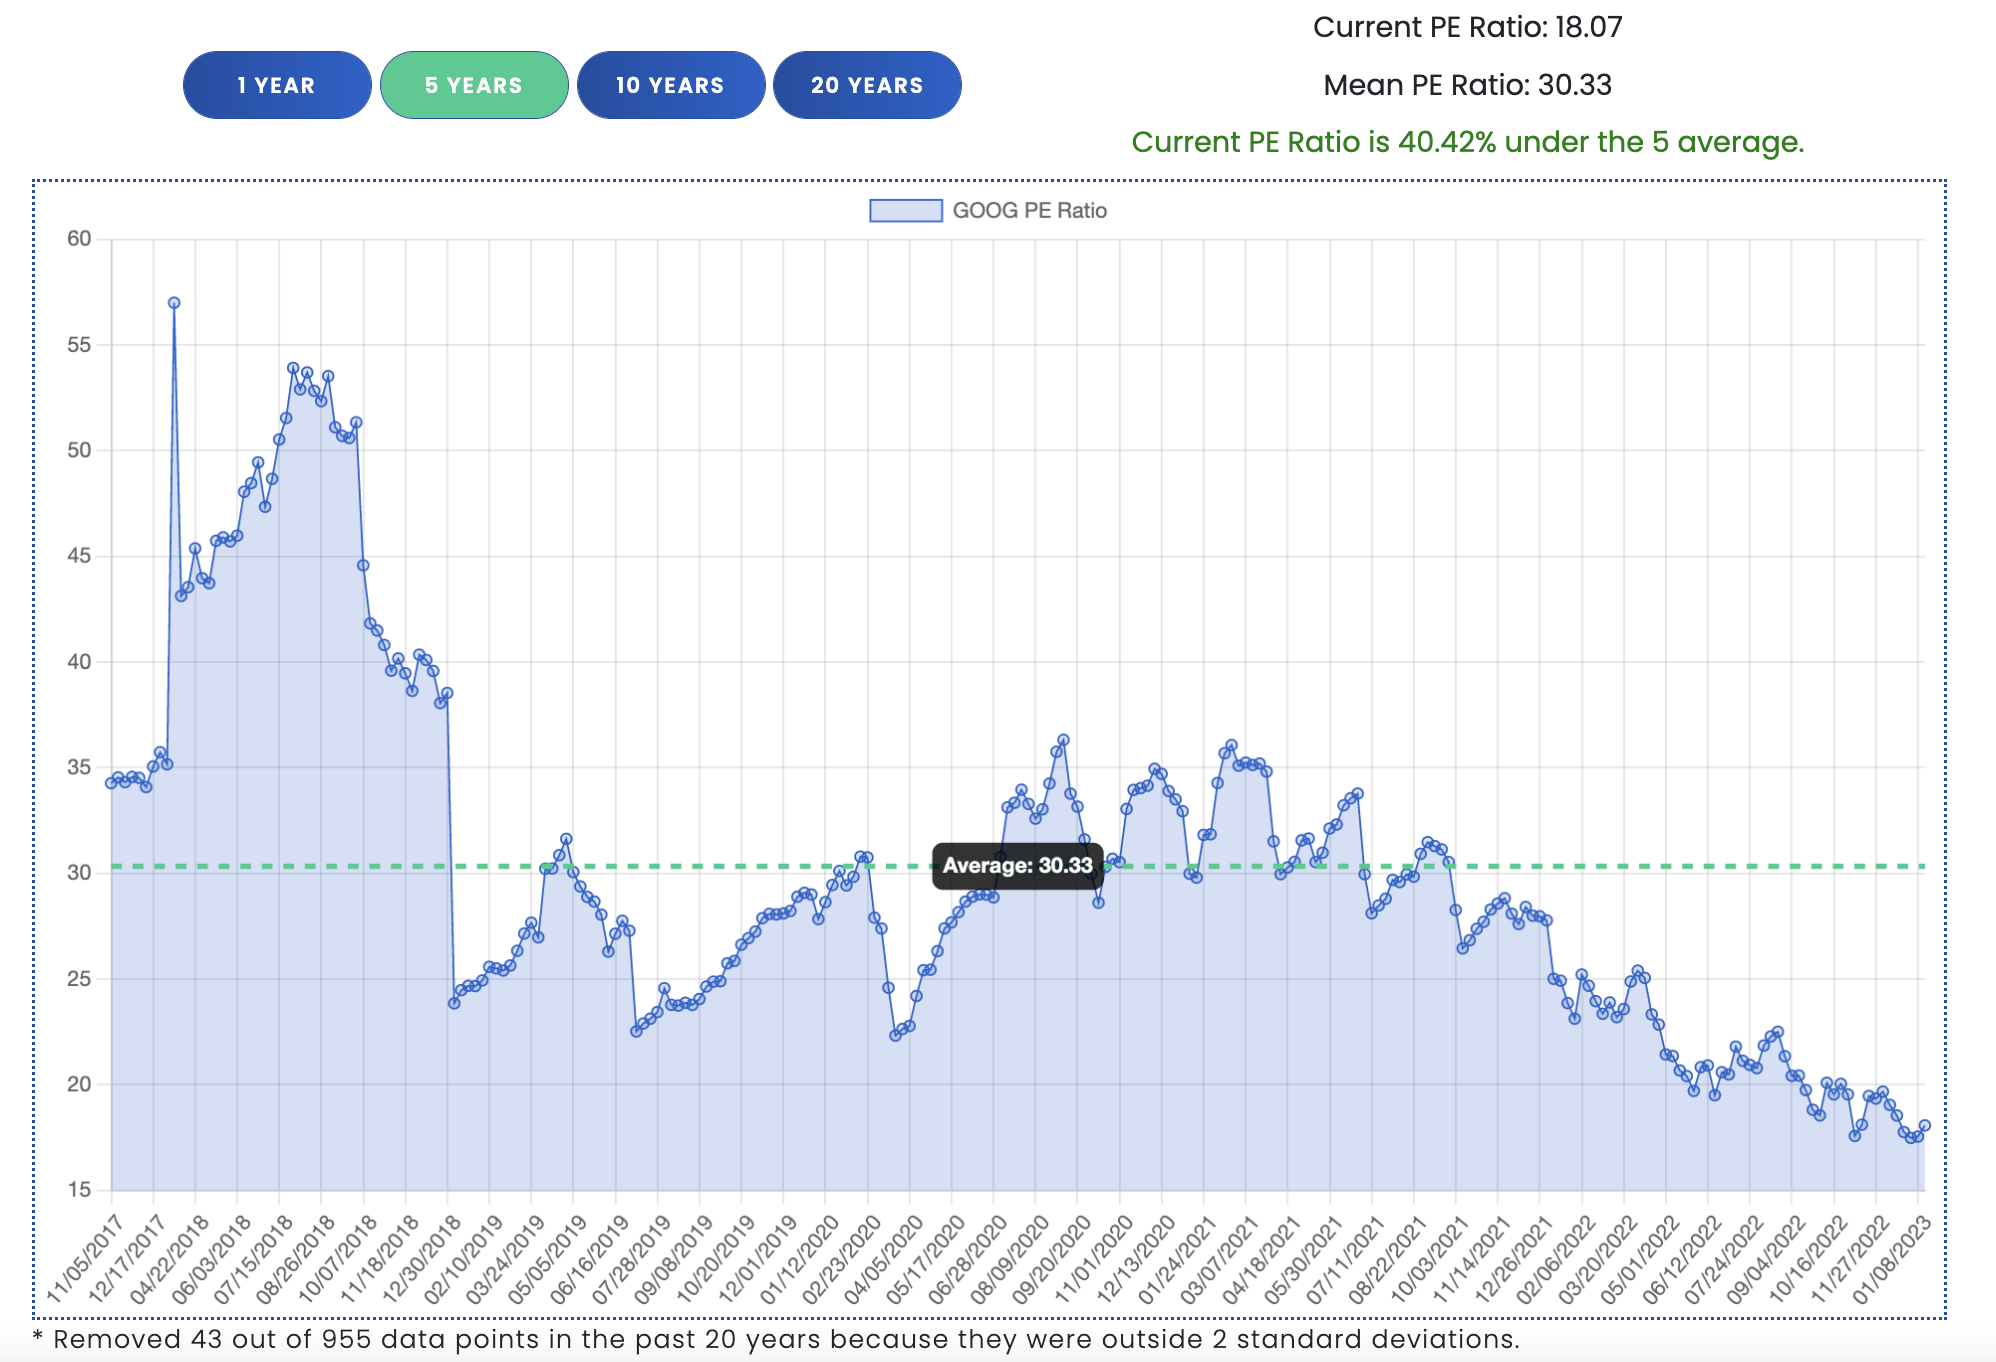
PE Ratio
Our historical PE ratio page allows investors to quickly compare current PE ratio to historical averages. Looking at Alphabet’s current PE ratio of 18.66 to their historical PE ratio over a few different time periods shows it’s currently trading under historical averages.
Share Buybacks (Repurchases)
Alphabet authorized a share buyback program allowing them to repurchase $70 billion of its Class A and Class C shares in April 2022. This allows them to put their cash to work and return some value to investors.
As of September 2022, there is $43.5 billion remaining (about 3.625% of current market cap). In the quarter ending September 30, 2022, they had repurchased 138 million shares for $15.4 billion. In the first 3 quarters of 2022 they have repurchased 369 million shares for $43.9 billion.
|
|
Shares Repurchased |
Total Cost |
Adj. Cost/Share |
2017 |
5,200,000 | $4,846,000,000 | $46.60 |
2018 |
8,200,000 | $9,075,000,000 | $55.33 |
2019 |
15,300,000 | $18,396,000,000 | $60.12 |
2020 |
21,500,000 | $31,100,000,000 | $72.32 |
2021 |
20,300,000 | $50,300,000,000 | $123.89 |
3 Quarters 2022 |
369,000,000 (post-split) | $43,900,000,000 | $118.97 |
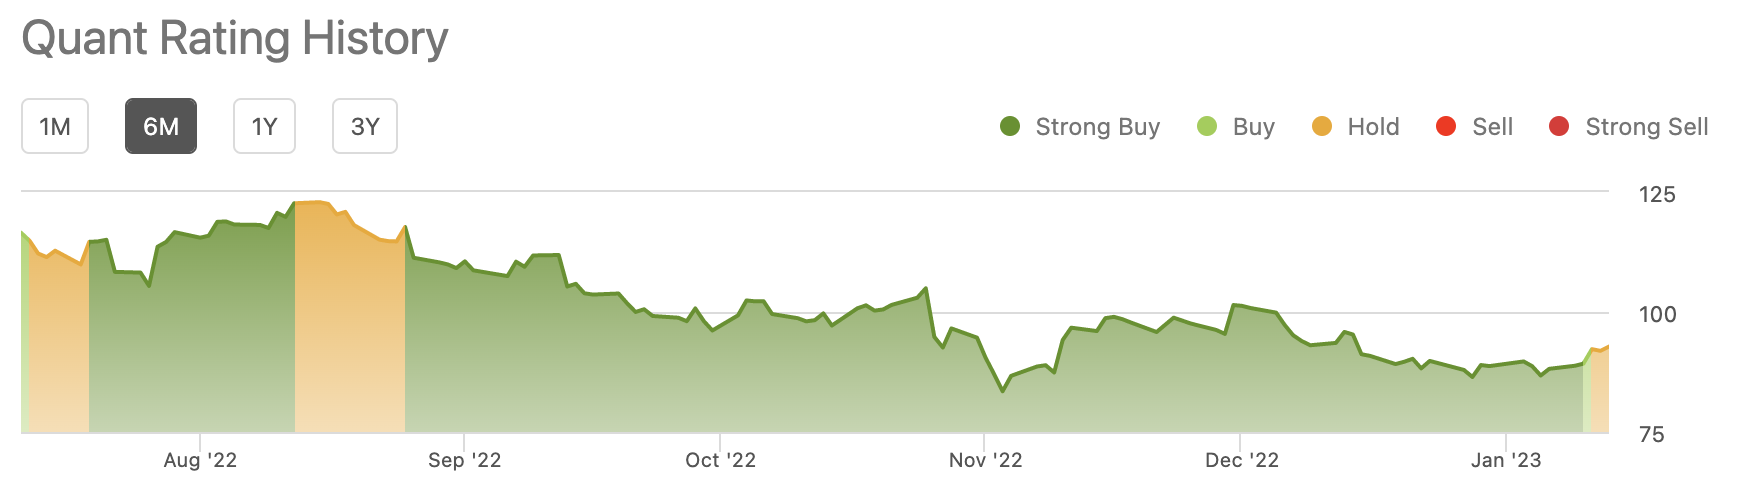
Quant Rating
When I began writing this article, Seeking Alpha had provided Alphabet a quant rating of Strong Buy, with a score of 4.55. Since that time (I take too long to write articles!), it has dropped to 3.55, which is about in the middle of hold and buy.
If you don’t know what Quant Ratings are yet, they are provided by Seeking Alpha’s special ‘quantamental’ analyses. Companies rated as a strong have gone on to greatly outperform the S&P 500 over the past 12 years as shown in the chart below (provided by Seeking Alpha). I personally use the quant ratings as a great starting point for finding companies, but then always do my own research and valuation in addition before making any purchases.
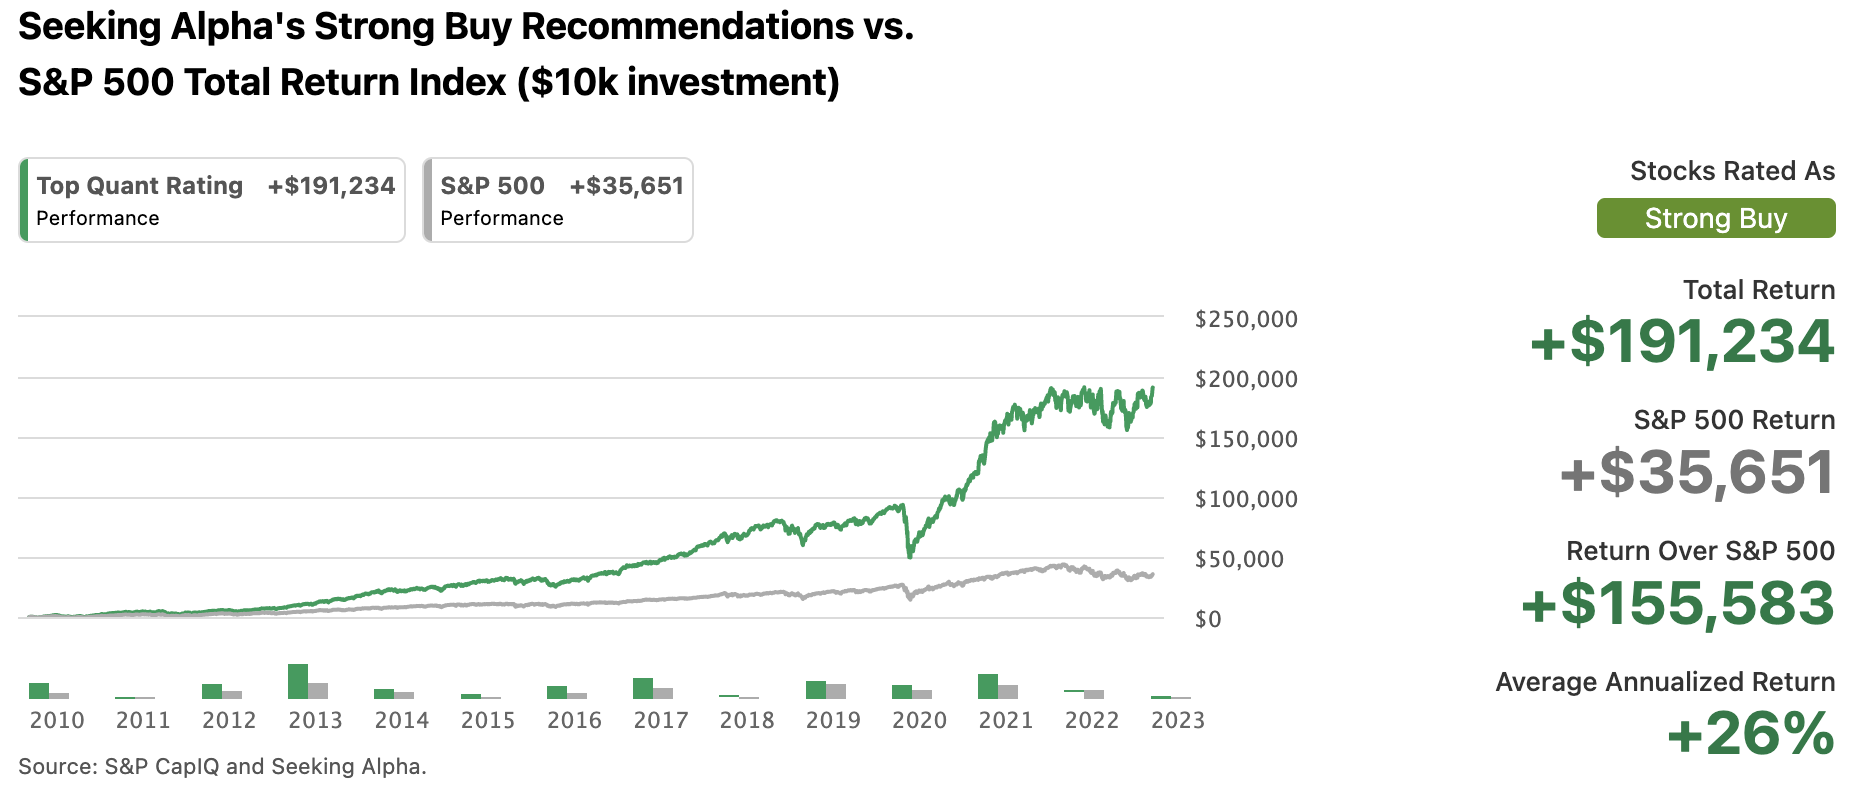
If you’re interested in finding other companies with a strong buy rating, you can sign up for a free trial to Seeking Alpha Premium/Pro here. I may receive a small commission if you end up signing up for an annual plan after clicking the link.
Intrinsic Value - Discounted Cash Flow (DCF) Calculation
It’s time to take all the information we found and come up with our own intrinsic value. To come up with an intrinsic value, we will be using our DCF calculator, which allows for finer tuning and is easier to see how certain changes affect valuation.
I’m going to do two valuations, one is my base case, where my assumptions will be that Alphabet continues to dominate the advertising market without any major disruption, continues to grow their cloud business (and it begins to be profitable), and continues to grow and monetize YouTube/Shorts.
The second is my less optimistic case, where my assumption is that there is major disruption to the search engine sector, and Google sees their revenue stagnate earlier than expected, as well as margins struggle to grow from current levels.
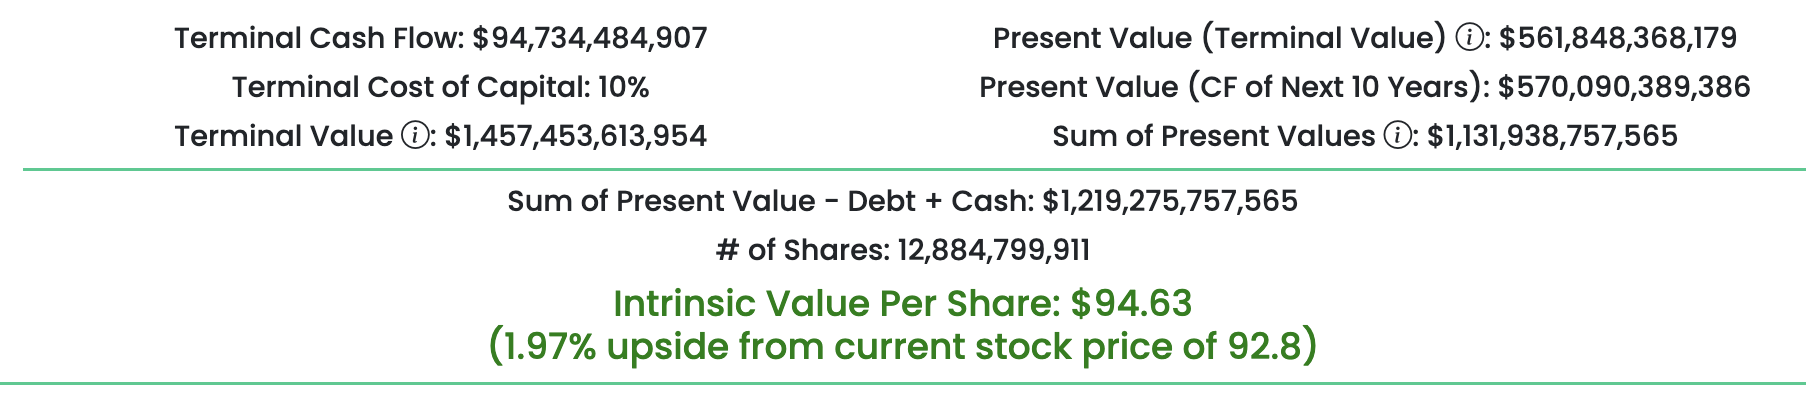
Base Case
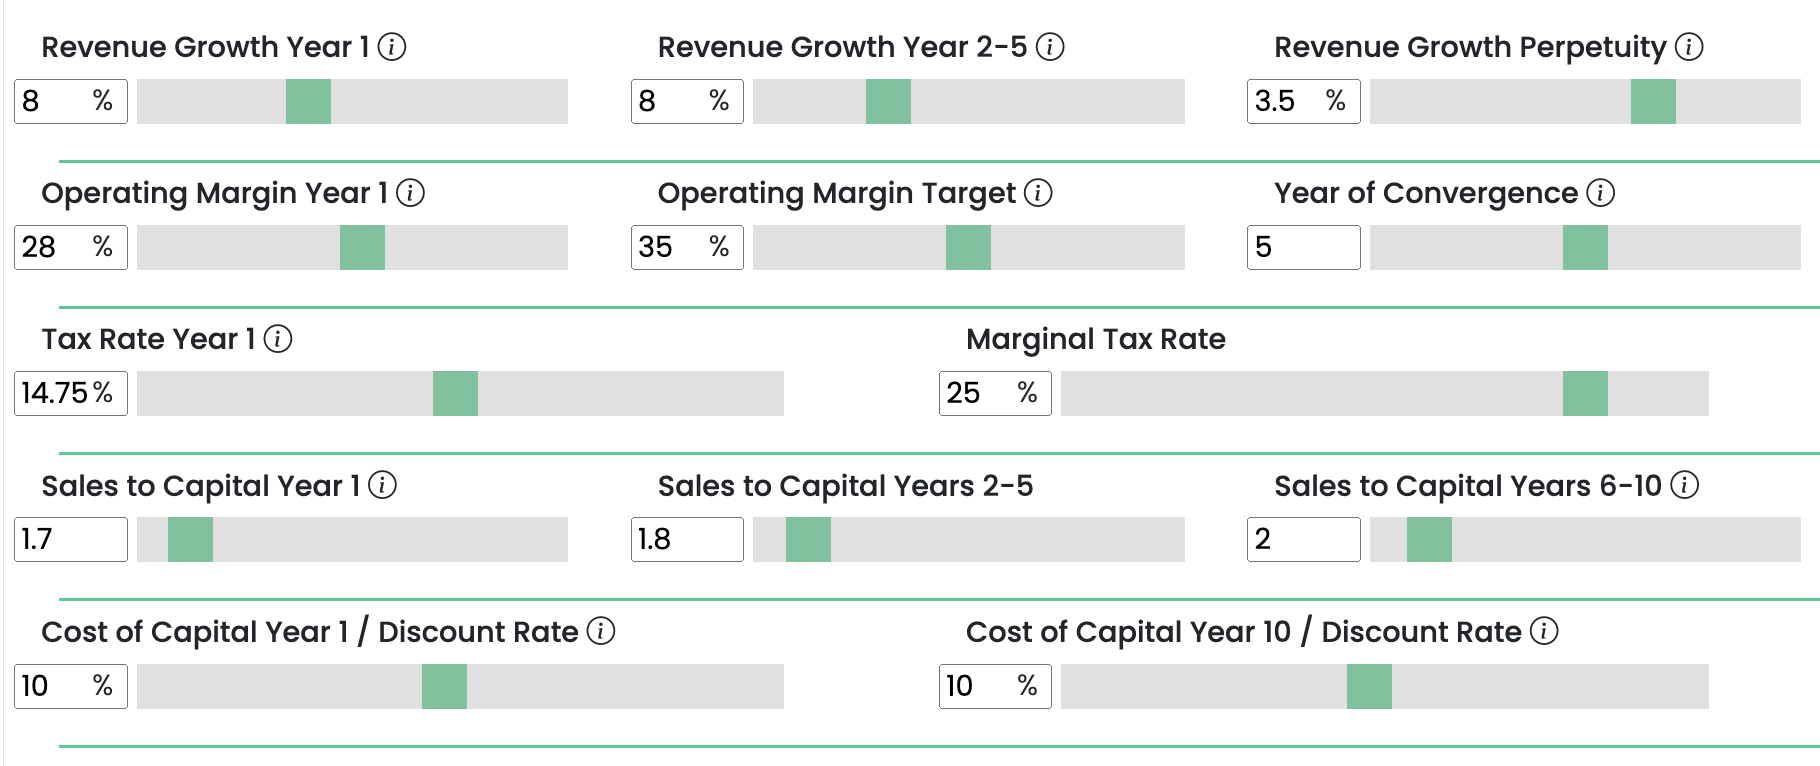
Revenue Growth Year 1: 8%
Analysts are predicting between 8-10% revenue growth for 2023, which may be a little high if advertisers continue to cut budgets going into a recession. Google Cloud will continue to grow well above that.
Revenue Growth Years 2-5: 8%
Google Cloud continuing to grow will help Alphabet maintain decent revenue growth going forward, as long as advertising revenue doesn’t see negative growth.
Revenue Growth in Perpetuity: 3.5%
Maintain 3.5% growth in perpetuity. The 10-year treasury is often used to prevent impossible growth rates.
Operating Margin Year 1: 28%
Continued headwinds in currency exchange will hurt this going into next year as well. A lot of Alphabet's costs are in USD, while their revenue is global.
Operating Margin Year Target: 35%
With other areas of Alphabets business becoming profitable, such as Google Cloud and some of their ‘Other Bets’ businesses, they should be able to increase operating margin significantly.
Year of Convergence: Year 5
It will likely take a few years before they reach the operating margin target, with current headwinds in currency exchange, lower ad revenue, and continued heavy investment in the cloud segment.
Tax Rates: 14.75% > 25%
Gradually increase current tax rate of 14.75% to marginal tax rate of 25% by year 10.
Sales to Capital: 1.7, 1.8, 2.0
Sales to capital ratio is an efficiency ratio, first taught to me by the Dean of Valuation, Professor Aswath Damodaran. It essentially calculates how efficiently a company can turn one dollar of capital into one dollar of revenue and is calculated by dividing revenue by invested capital. This allows me to account for future reinvestment needs going forward.
Discount Rate Year 1: 10%
Although modern valuation theory teaches using weighted average cost of capital as the discount rate, I sometimes prefer to use a 10% opportunity cost instead, which Charlie Munger and Warren Buffett have hinted at using.
Discount Rate Year 10: 10%
When I do use cost of capital, I will often use different numbers in year 1 and 10. This is done to normalize certain numbers such as the risk-free rate.
Intrinsic Value Per Share: $94.63 (1.97% upside from current price of $92.80)
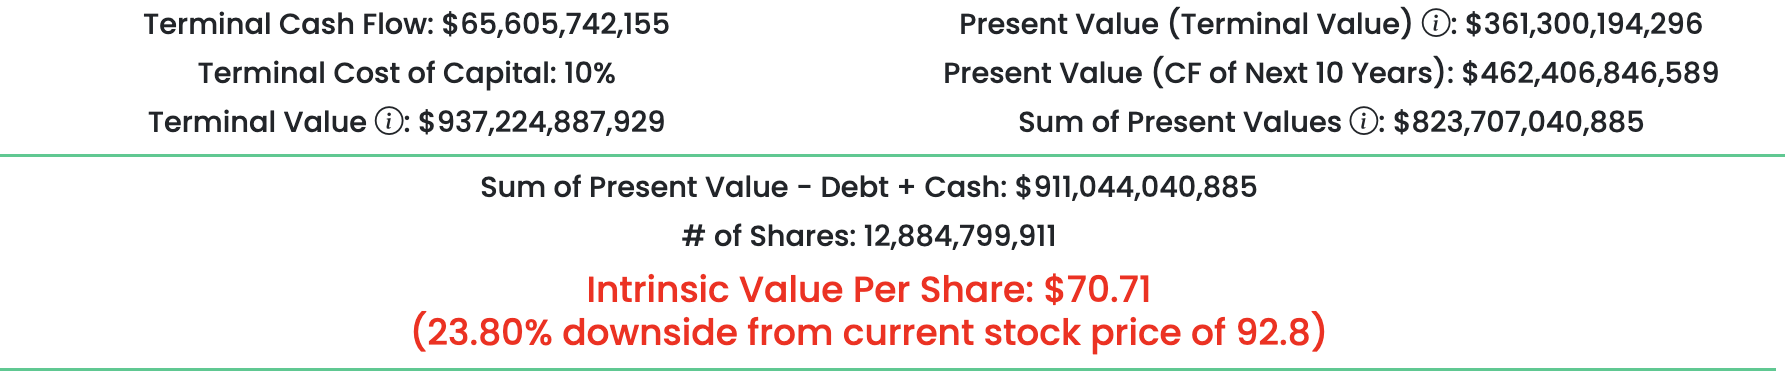
Less Optimistic Case
For the less optimistic case 2 I’m changing revenue growth and operating margin target. Alphabet’s revenue is still driven largely by the Google search engine, and the search engine sector may be in for some major changes soon. If Google can’t adapt, their revenue growth will slow (or even turn negative) and operating margin will struggle to increase as advertising is responsible for keeping it high while other areas are losing money.
Revenue growth year 1: 3%
Revenue growth years 2-5: 3%
Revenue growth in perpetuity: 3%
Operating Margin Target: 32%
Intrinsic Value Per Share: $70.71 (23.8% downside from current price of $92.80)
Conclusion
Alphabet has been a company I’ve wanted to own for a long time, but I always found them to be overvalued. With the recent drop of over 40%, I decided to finally start a small position, despite my reservations.
Although the search engine market is rapidly changing, I lean towards Google still being the go-to for the foreseeable future. Despite the threat of new technologies such as Chat GPT, I think a lot of people will continue to use Google, where they can have multiple options for their questions, and be able to view the source of the answers. If Chat GPT does start to take over, I feel Google will find a way to compete with them, but I’m unsure how that scenario will affect Alphabet’s advertising revenue.
Alphabet also has a lot of other projects that can turn into huge successes. Waymo, their self-driving car, has shown great promise so far. Although not providing income at this point, it has a great opportunity over the next 20+ years. Google Cloud has been expanding rapidly and will likely continue to expand as the world continues to move towards a future where everything is online. YouTube is another source of light for Alphabet, with streaming becoming more and more popular, Alphabet has the benefit of not having to pay for content up front like other streaming services.
All that being said, I can see a scenario where Alphabet continues to drop, particularly over the next year as companies spend less on advertising. At current levels I have them at roughly fair value, with not a huge margin of safety. If the share price does continue to drop, I will likely buy more, and if not, I will be happy with the small position I finally bought in at.
Similar posts
Netflix - Deep Dive and DCF Calculation
Micron (MU) Intrinsic Value - DCF Calculation - Deep Dive
Alibaba Deep Dive - Discounted Cash Flow Calculation - Intrinsic Value
0 comments
There are no comments yet.