Netflix has made a lot of headlines lately, with the share price dropping over 72% over the last 5 months from a high of over $700 to the current price of $190. Bill Ackman recently sold his position, taking a big loss and admitting that his analysis of the company was wrong. But now, with the share price at levels not seen in over 4 years, does it represent an opportunity? Has Netflix moved from a growth company into value territory?

In this blog post we’re going to look at the history of Netflix, some interesting facts about their business, and finally a discounted cash flow calculation, to see if the intrinsic value we come up with shows Netflix as undervalued or overvalued.
- History of Netflix
- Subscribers & Overall Market Size
- Content Assets - Licensed vs Produced
- Competition
- Content Spend
- Amortization of Content
- Financials
- Intrinsic Value - DCF Calculation
- Conclusion
A Brief History of Netflix
Netflix was founded in 1997 by Reed Hastings and Marc Randolph as a DVD mail-based rental business, to compete with Blockbuster. Reed Hastings is still with the company today, and Chairman and Co-CEO.
They started the online streaming service in 2007, and in 2014 began making original content (prior to that they would license content, generally re-runs). In 2017 they began development of international productions.
In 2021 they achieved the most academy nominations of any studio with 36, of which 7 were won. They also made an agreement with Sony Pictures in 2021, giving them exclusive streaming rights for their content. Netflix expanded into the gaming space in 2021, acquiring a few companies to help accelerate their growth in the space.

In 2022 they announced a plan to cut back on account sharing, as well as a new subscription plan that will have commercials, but cost less. These features are planned to be implemented in 2023.
Netflix Subscribers & Overall Streaming Market Size
As of the first quarter of 2022, Netflix had 221,640,000 subscribers, down 200,000 from the previous quarter. This is the first quarter ever that they have had a net loss of subscribers. 700,000 subscribers were lost due to pulling out of Russia, so excluding that they would have had a net gain of 500,000 subscribers, still well below the 2.5 million they had forecasted. What’s worse is the 2 million they are now forecasting they will lose in the next quarter. Despite this, they are still predicting a net gain for the fiscal year of 2022.
The chart below shows their subscriber growth over time, presented by statista.
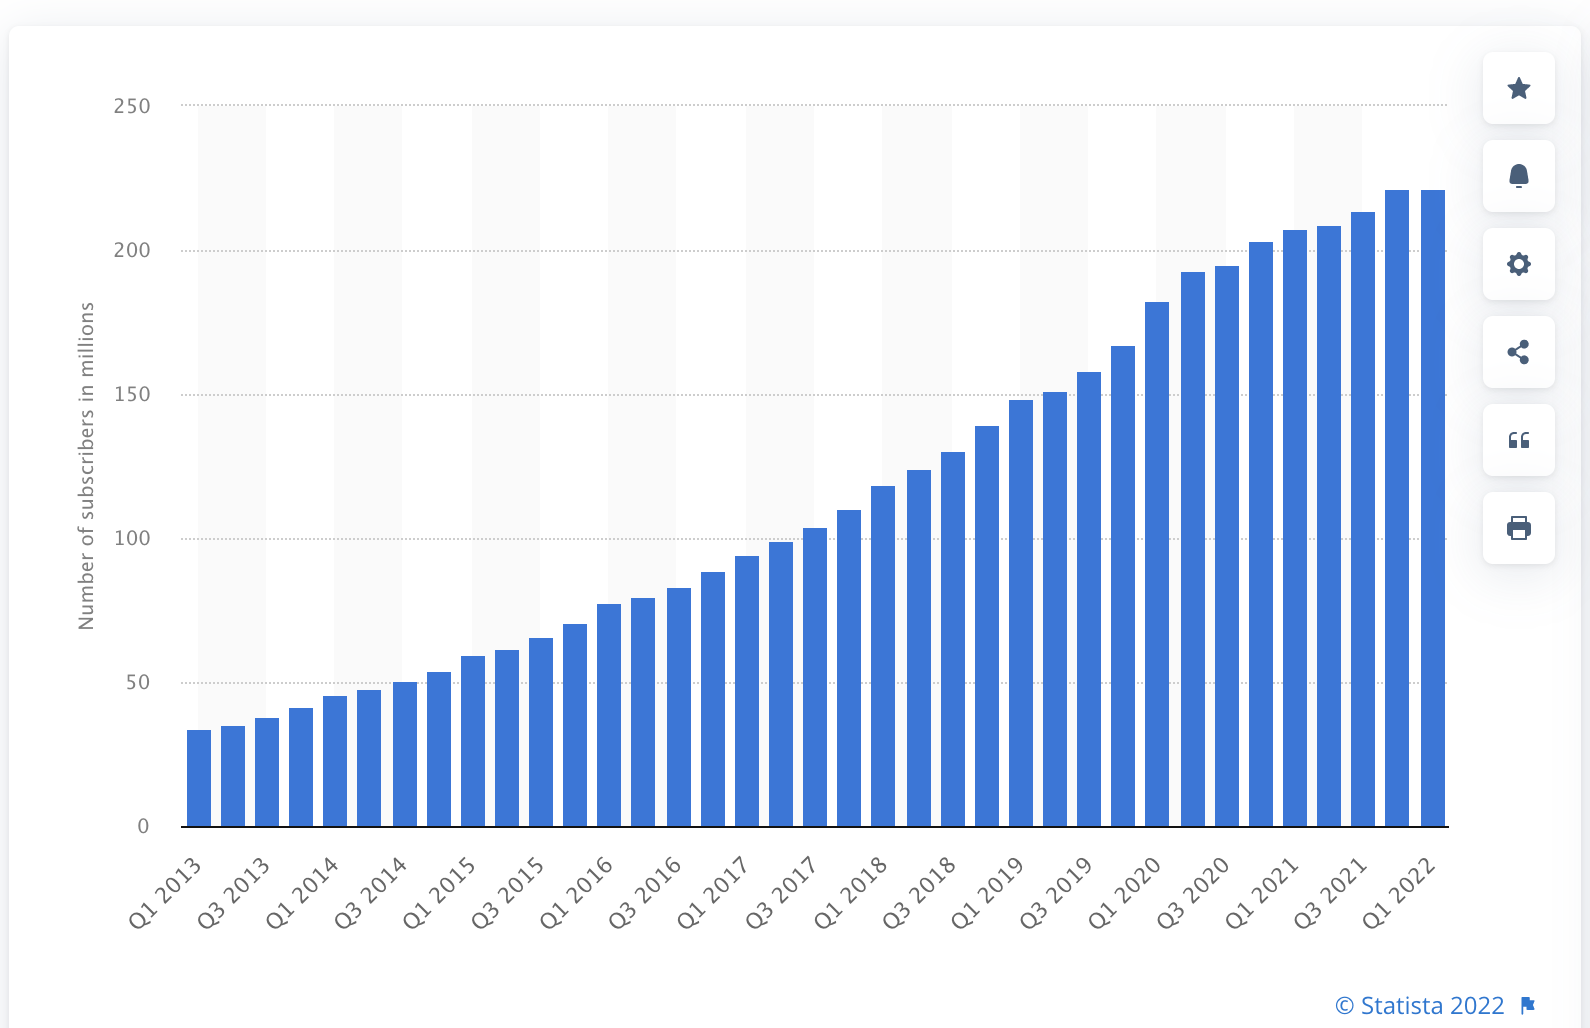
In 2021, 90% of their paid net additions came from outside Canada and the United States. The global streaming market has grown to an estimated $70 billion in 2021, and is estimated to grow to $330 billion by 2029 (according to a research report by GrandViewResearch). According to Nielson, streaming accounts for 29.7% of total TV time in March of 2022, compared to 36.9% for Cable, and 24.9% for Broadcast. .
Netflix Competition - Streaming Wars
The streaming industry is very competitive and has seen many new/existing companies enter the space in the last few years. Some of those competitors have very deep pockets and are able to spend a ton of money on content. Competitors such as Disney and Warner Brothers Discovery already have vast amounts of existing content.
Some of Netflixs' top competitors are listed below:
- Disney+ (launched November 12, 2019)
- Amazon Prime Video (launched in 2006, but added to Prime membership in 2011)
- HBO Max (launched in 2020. WarnerMedia recently merged with Discovery forming Warner Bros Discovery (WBD))
- YouTube
- Apple TV+ (launched November 1, 2019)
- Peacock
- Hulu
- Paramount+
- Crave TV

So, what affect does the increase in competition have on Netflix? It affects them in a few different ways. First, they are losing licensing rights to certain shows, as the producers would rather put the shows on their own streaming platform. One example of this is the show ‘Friends’, which Netflix had streaming rights for. WarnerMedia did not renew the license to Netflix after it expired, and is now streaming the show on it’s own platform, HBO Max. There are many shows in the same position.
Increased competition also limits the pricing power Netflix once had. It’s a lot easier to continue raising the price when you are the only viable option, but as competitors build their platforms, continue to spend on new content, and offer a competing product for a cheaper price, Netflix will not be able to continue raising prices without the risk of losing customers to those platforms.
Finally, it creates the risk of ending up in a never-ending spending war while attempting to maintain the position of the top streaming service. Netflix currently has the most subscribers out of all streaming services, but they are barely cashflow positive due to the amount they are spending on content. We will talk about this more during our valuation, but an important question is how does Netflix become cashflow positive to a point where the valuation makes sense?
Netflix Content Assets - Licensed vs Produced
The table below shows the amount of content assets Netflix has, and how it has evolved over time. Netflix has really pumped up the amount they are spending on produced content in comparison to licensed content. They predict this will help them to continue to grow going forward and help them increase operating margins over time (no studio middleman).
Licensed Content |
Produced Content |
Total Content Assets |
|
| 2017 | $11,771,778,000 | $2,896,910,000 | $14,681,989,000 |
| 2018 | $14,081,463,000 | $6,020,864,000 | $20,112,140,000 |
| 2019 | $14,703,352,000 | $9,801,215,000 | $24,504,567,000 |
| 2020 | $13,747,607,000 | $11,636,242,000 | $25,383,950,000 |
| 2021 | $13,799,221,000 | $17,120,318,000 | $30,919,539,000 |
| 2022 Q1 | $12,923,692,000 | $18,268,228,000 | $31,191,920,000 |
Netflix Content Spend
Netflix continues to spend mass amounts on content in their goal to maintain the largest share of the streaming market. In 2021, they spent over $17 billion in new content, which is the most spent when you exclude sports rights and theatrical releases. Disney spent over $25 billion (although I couldn’t find a direct breakdown on how much of that was for streaming, sports rights, theatrical releases, or linear TV). Warner Brothers Discovery spent a combined $23 billion, but a lot of that is for sports rights and linear TV.
Disney plans to spend even more in 2022, estimating content spend of $33 billion. Analysts estimate about $15 billion of that is for streaming original content. Netflix is estimated to spend around $19 billion in 2022, although they have mentioned they may pull back some after their latest earnings report, in order to maintain operating margins in line with 20%. Warner Brothers Discovery on the other hand, plans to cut back on content spend and maintain being cashflow positive. They announced they are focusing on better monetization of HBO’s current content library, and will not overspend on content trying to drive subscriber growth.
Here is a list showing how much Netflix has spent on content over the last 5 years.
- 2017: $9.8 Billion
- 2018: $13 Billion
- 2019: $13.9 Billion
- 2020: $11.8 Billion (Some content creation was delayed due to covid, leading to the drop in 2020 and rise in 2021)
- 2021: $17.7 Billion
Netflix Amortization of Content
Amortization of content allows companies to expense content over the projected useful life of the asset rather than all at once. It is similar to how depreciation works for tangible assets. For streaming, accounting standards allow for subjectivity. Amortization can occur in a linear basis or accelerated basis, the difference being accelerated is more front loaded, while linear would simply be the total cost divided by the useful life, so the amortized amount would be the same every year during the useful life.
Being that streaming revenue is generally from subscriptions, it’s hard to quantify the exact value of a show over time, as opposed to direct cable. How many people are going to start a new subscription because of a show that is 4 years old? How many people will stay subscribed due to older content that they may not have watched yet? It’s impossible to know those answers.
In the chart below I show the interest over time (according to Google search) of two Netflix originals. This also demonstrates a flaw I believe in Netflix's business, in that they like to release full seasons at once, rather then one episode per week. Squid Games, which is Netflix's number 1 show ever, spikes in interest then drops off quickly, compared to Snowpiercer(not even a top 10 show according to Netflix) which maintains steady interest over time. Squid Games was released all at once, while for Snowpiercer they released one episode at a time. Maybe this is Netflix showing us that all the value of a show is in the first release? My only concern is how many people binge watch a series and cancel their membership until the next season they want to watch comes out.

Netflix says they amortize content in an accelerated basis, over the shorter of the title’s window of availability or estimated period of use or 10 years. On average, licensed or produced content will be 90% amortized within 4 years.
An example of this may be if the cost of a show was $10,000,000, and they wanted to amortize 90% over 4 years in an accelerated fashion, they may show a cost of $5,000,000 they first year, $2,500,000 the second year, $1,500,000 the third year, and $1,000,000 the fourth year.
This is important to understand when looking at their financial statements, as depending on your story for the future of the company, this can really affect their earnings/cashflow.
Netflix Financials
We’re going to look at GuruFocus. to get all the financials and insider transactions, which in my opinion is the best website for getting financial data, specifically for value investors. It has without question the best screener for finding potential investments. For the purposes of this blog post, we will be sticking to just a few main metrics.
Revenue & Cost of Revenue
Netflix had revenue of $30.4 billion in the TTM ending March 2022, up from $29.7 billion in fiscal year (FY) 2021, and $25 billion in 2020. They have had a 5-year compound annual growth rate (CAGR) of 26.5%.
Cost of revenue includes the amortized amount of content, which explains why it is so high. In 2021 it was $17.3 billion ($12.2 billion amortization of content), compared to $15.3 billion ($10.8 billion amortization of content) in 2020, and $12.4 billion ($9.2 billion amortization of content) in 2019.
Operating Margin
Netflix had an operating margin of 21% for 2021, up from 18% in 2020, and 7% in 2017. They are currently forecasting 19-20% for 2022 and 2023, at which point they are targeting 3% increases per year.
Net Income
Net income was $5.1 billion for 2021, up from $2.76 billion in 2020, and $1.87 billion in 2019. The 5-year CAGR was 94%.
Cash Flow
Netflix was cashflow negative for the last 10 years excluding 2020. This was largely due to the amount they have been spending on content. They have said they will be cash flow positive from here on out and mentioned all excess cash generated will be returned to shareholders via buybacks.
Cash flow from operations was negative 2.9 billion in 2019, +$2.4 billion in 2020, and +392 million in 2021.
Insider Transactions
Looking at gurufocus insider trades, it’s clear to see management has been selling shares a lot more than buying over the last 2 years. It doesn’t seem the directors own many shares either. This is not inspiring confidence for potential investors.
Netflix Intrinsic Value - Discounted Cash Flow (DCF) Calculation
Finally, after looking at all the important details of the business, we’re ready to do our intrinsic value calculation. To come up with an intrinsic value, we will be using our DCF calculator, which makes it a lot easier. It comes pre-loaded with the last 5 years of figures and allows us to change various growth rates/margins /discount rates to see how it affects the intrinsic value per share.
I’m going to do two valuations, one is my base case, where I will input what I think is more likely to happen over the next 5-10 years. The second is my slightly less optimistic case, where I think Netflix will have to continue spending more on content, and will see their subscriber growth (and thus revenue growth) stall.
As I know some people prefer using a desired rate of return rather than cost of capital for their discount rate, I will use both so you can see the difference. If you want to change some variables, head over to our DCF calculator.
Base Case

Revenue Growth Year 1: 9%
In line with analysts.
Revenue Growth Years 2-5: 7%
Analysts are predicting 9% next year, and around 10%/year for the next 5 years. I think that is a bit too optimistic. Although I think subscribers will continue to grow as the expand globally, the average revenue per membership is lower in the areas they are expanding too, while creating local content in those areas is expensive. I also don't think Netflix has the pricing power they once had not that their is more competition.
Revenue Growth in Perpetuity: 3%
We are going to use the current risk-free rate for this, to prevent 'impossible' growth rates, and for valuation consistency. At the time of writing the 10-year treasury note was 2.974%.
Operating Margin Year 1: 20%
This is the companies’ guidance, and they have said they will manage content spend to maintain margin, so we can use this number with high confidence.
Operating Margin Year 10: 30%
This is the main variable that will affect our valuation. The big question is whether Netflix will have to continue spending more on content to maintain subscribers, or as their content library grows will they be able to either cut back on spending or maintain spending while revenue continues to grow. We are going to use 30% for our base case.
Tax Rates:
We are going to leave the tax rates as the default, which will slowly bring the effective tax rate up to the marginal tax rate over 10 years.
Sales To Capital:
Again, we are going to leave these at 1.2. Sales to capital is an efficiency ratio, showing how much reinvestment is needed for each dollar of revenue.
Cost of Capital (Discount Rate) Year 1: 6.53%
We pulled this directly from GuruFocus.
Cost of Capital (Discount Rate) Year 10: 7.75%
Most mature companies have a cost of capital around risk-free rate +4.5%.

Intrinsic Value Per Share: $267.63 (34% undervalued from $199)
Intrinsic Value Per Share with 10% Discount Rate: $177.71 (11% overvalued)
Case Two
For case two I will be keeping all inputs the same, except operating margin in year 10. I will be using a lower operating margin in year 10 to represent a continued high content spend relative to revenue growth.
Operating Margin Year 10: 25%
Intrinsic Value Per Share: $224.01 (12.5% undervalued from $199)
Intrinsic Value Per Share with 10% Discount Rate: $148.80 (25% overvalued)
Conclusion
As a potential investor in Netflix, these are some of the questions I asked myself:
- Will they be able to continue to grow their revenue as they further expand globally?
- How is their subscription with commercials going to affect their financials long-term?
- How many of the 100 million people sharing passwords will they be able to convert to higher priced subscriptions?
- Will they higher priced subscription that allows sharing make other users switch/cancel accounts and start sharing results in a net loss in revenue?
- Once they reach the point where they won't see many more new subscriptions, how much will they have to spend on content to maintain them?
- At a $90 billion market cap, how long will it be before I receive my investment back in free cash flow?
- Netflix is the streaming leader today, but will they still be in 5 years? How is the competition going to affect Netflix?
Depending on the answers you come up with, Netflix may present a great opportunity at current prices. At this moment in time, I have not invested. This is partly because I can't answer some of those questions yet, and there simply isn’t enough of a margin of safety for me.
Disclaimer: I only recommend products I would use myself. This blog post contains affiliate links that may give me a commission if users sign up. We have attempted to give our honest opinion throughout the blog post.
Similar posts
Alphabet: Recent Drop Provides Buying Opportunity (NASDAQ:GOOG)
Micron (MU) Intrinsic Value - DCF Calculation - Deep Dive
Alibaba Deep Dive - Discounted Cash Flow Calculation - Intrinsic Value
0 comments
There are no comments yet.