Price to Earnings Ratio (P/E Ratio) is one of the most popular profitability and valuation metrics to look at for potential investors. It is often the first number investors look at. It has multiple variations such as trailing P/E, forward P/E, and CAPE ratio. But is it as important as everyone thinks? What variation should you use? Does it tell the full story? Let’s take a further look.
What is the Price to Earnings Ratio?
The price-to-earnings ratio is the relation between the current price of a stock and its earnings. Another way to look at it is how much you would be paying per dollar of net income. The most common metric people look at is the trailing P/E ratio, which generally looks at the earnings of a company over the previous 12 months. It is calculated by dividing the current share price of a company by the ttm (trailing twelve months) diluted earnings per share (EPS).

Let’s look at an example to get a better understanding of trailing P/E Ratio.
For the last 12 months Apple had a reported EPS of $4.45. To get the price to earnings ratio we then divide the current share price ($125.43 at time of writing) by the earnings per share of $4.45 to get a PE Ratio of 28.19. This suggests you would be paying $28.19 per dollar of annual earnings. This is sometimes also referred to as P/E multiple (if you were to buy apple you would be paying a 28x multiple of earnings at the time of this article).
Forward price to earnings ratio on the other hand is a prediction. To get it you divide the current share price by the estimated or projected earnings per share of a company. Often times a company or analysts will release forecasts for companies. The current estimate for Apple is $5.36 EPS for 2022 based on 38 analysts. That would give a forward P/E Ratio of 23.41. It is important to remember this is based on analysts’ predictions and is constantly changing.
How to use the P/E Ratio
The PE ratio is often used to see if a company is currently overvalued or undervalued. This can be done by looking at the current P/E ratio and comparing it to historical averages as well as to other competing companies in the same sector.
Let’s go back to Apple for another example of how to compare with the competition. At the time of this writing Apple’s (AAPL) P/E ratio was 28.19, Alphabet’s (GOOG) was 31.25, and Microsoft’s (MSFT) was 33.41. Of course, Apple has other competitors, and you can pick whichever you want to compare, but for me these show a good comparison of similar companies. As you can see comparatively, Apple is undervalued based on earnings compared to Google and Microsoft. You can also compare it to the sector PE Ratio, which is currently 37 for technology.
Be aware that this is a comparative analysis, and all three could very well be overvalued. That is why the P/E ratio should be used as one of many tools in determining the fair value of a company.
Now let’s look at a historical chart to see how the P/E ratio has looked over the last 13 years. All current P/E ratios are above their average. The average of Apple and Microsoft are low 20’s, while the average of Alphabet is around 30, brought up a lot by 2017 earnings.

The CAPE Ratio
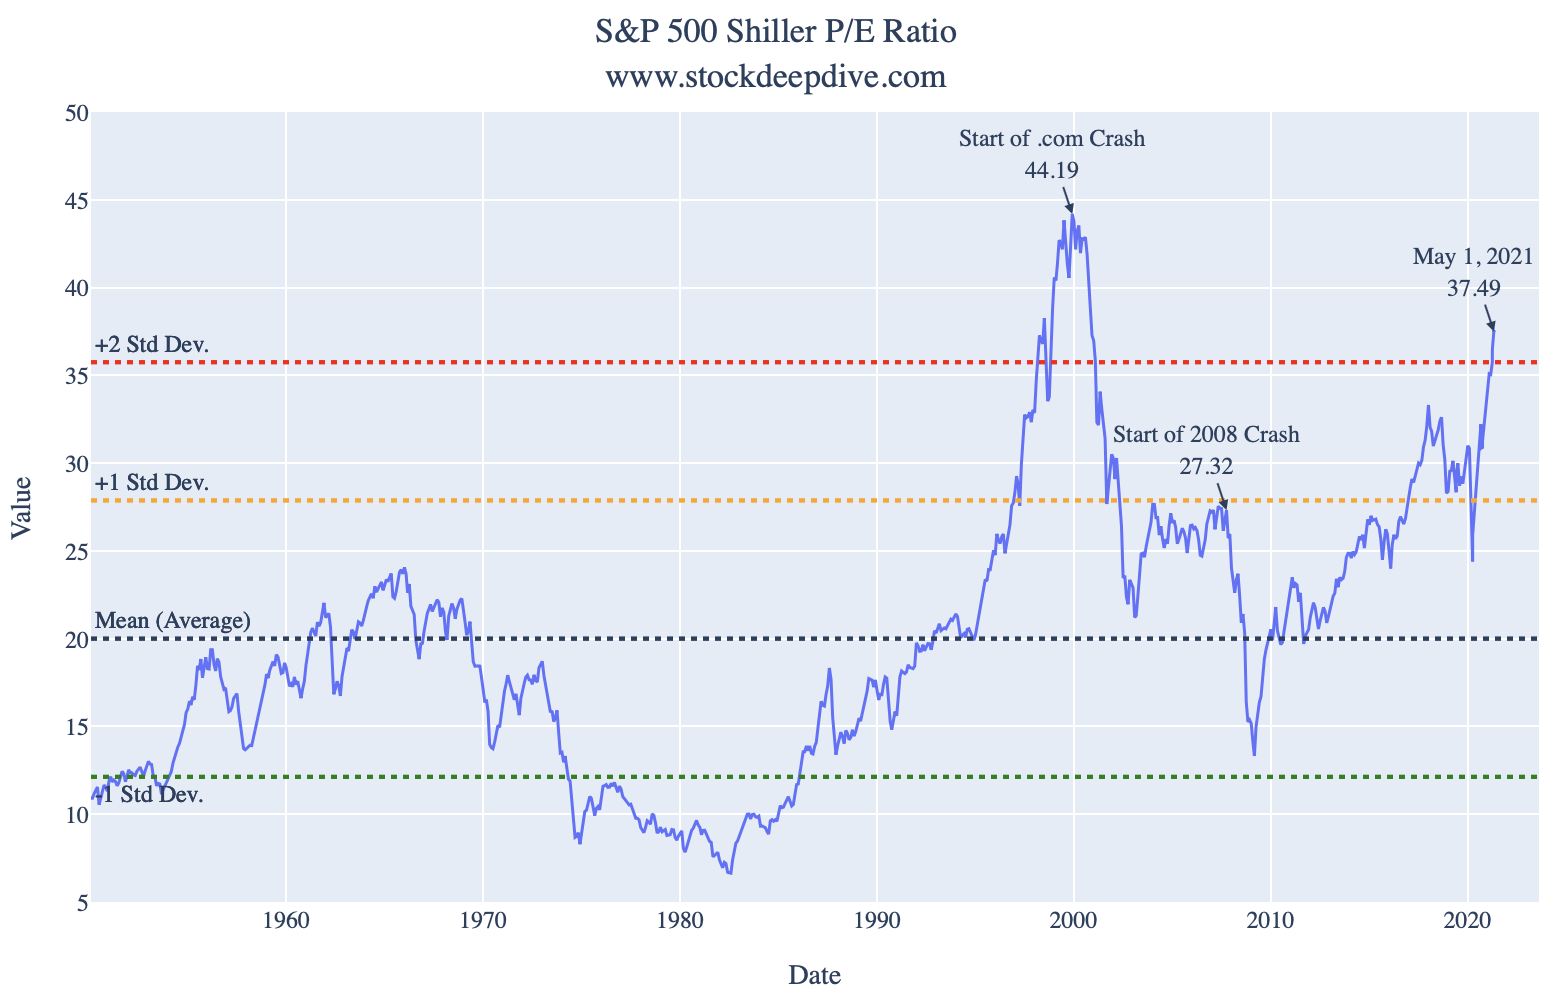
The Cape Ratio (Cyclically Adjusted Price-Earnings) is also known as the P/E 10 Year Ratio and the Shiller P/E Ratio (after Robert Shiller). It was invented by Robert Shiller as a means to smooth large fluctuations in earnings cycles (such as the one we saw in the previous graph). It looks at the previous 10 years of inflation-adjusted earnings to get an average. This is often also used as a metric to value the overall market, as we do on our Market Valuation page.
Here is a chart showing the S&P 500 CAPE ratio. As you can see it would currently suggest the S&P 500 is over-valued, although there are a lot more metrics to look at to get the full picture.
If you're interested in going a lot deeper with market valuations, interest rates, and the CAPE Ratio, I'd recommend reading Robert Shiller's book Irrational Exuberance: Second Edition.
Pitfalls of the P/E Ratio
Although the price to earnings ratio is a powerful metric that has its spot in valuing companies, it is important to also realize some of the pitfalls of it. At the top of that list is that for the most part, it is history-based, based on the companies previous earnings. And as I’m sure everyone has heard at some point; “past performance does not guarantee future results”.
Another issue when looking at long term P/E ratios, in particular the CAPE ratio, is changes in accounting practices.
Even the forward-looking P/E ratio has its issues. They are only a prediction based on analysts opinions. And often, they only forecast 1 year in advance, which doesn't give you a great idea where the company will be 10 years from now.
Just because a price-to-earnings ratio is over or under the historic average, or its competitors, doesn’t mean it is currently undervalued or overvalued. That may be the new normal. Or maybe the company’s core business will change (or be affected by a worldwide pandemic?) that will cause earnings to be effected in the next few years. There are lots of other factors to look at in order to get the full picture of a company.
Do you use the P/E ratio when making investment decisions? What other metrics do you look at? Let us know in the comments below!
0 comments
There are no comments yet.